SCTR Report: China Adds More Stimulus, FXI in Second Position
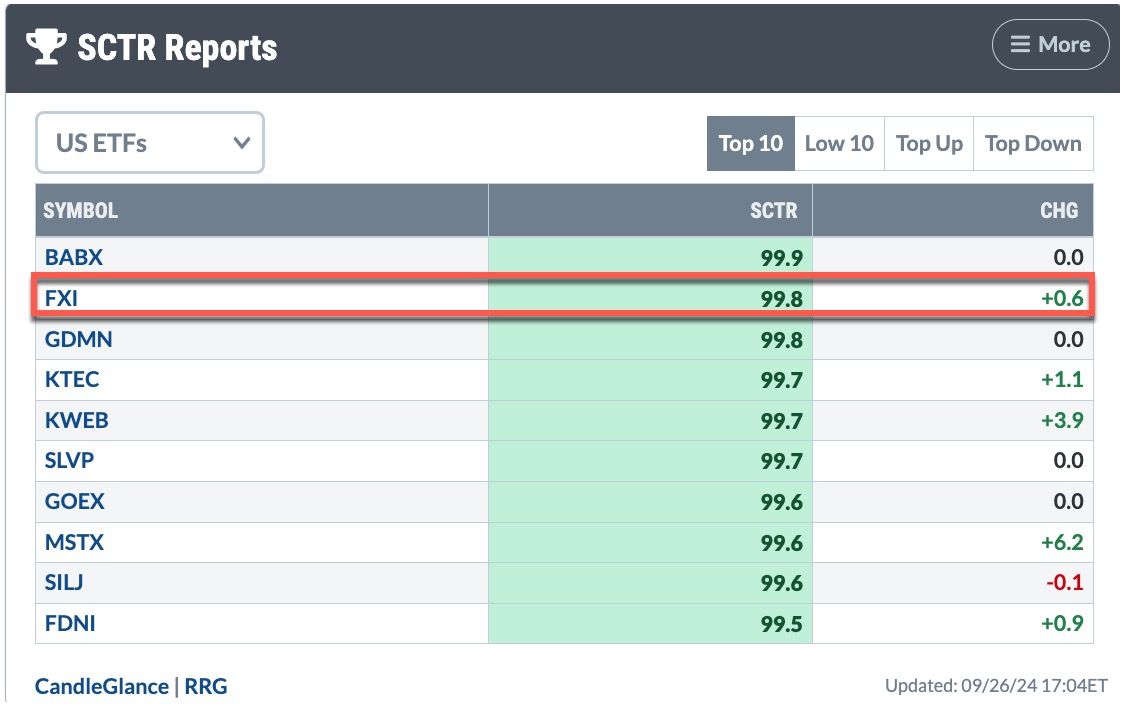
China’s injection of additional fiscal stimulus into its economy injected more optimism into equity markets. This sent share prices of Chinese stocks exploding to the upside once again. So it shouldn’t be surprising that the iShares China Large-Cap ETF (FXI) made it to second position in the StockCharts Technical Rank (SCTR) Report US ETFs Top 10 category. In addition, US equities, commodities, and cryptocurrencies soared, similar to the price action of the last couple of days.

FIGURE 1. SCTR REPORT OF SEPTEMBER 26, 2024. The iShares China Large-Cap ETF (FXI) took the number two spot for the US ETFs Top 10 category.Image source: StockCharts.com. For educational purposes.
Analyzing FXI
On Wednesday, the monthly chart of FXI showed that FXI was trading at its 23.6% Fibonacci retracement level. Thursday’s price action shifted the narrative. FXI has now broken above that level and is heading toward its 38.2% Fib level, which would be $33.83.

FIGURE 2. MONTHLY CHART OF FXI WITH FIBONACCI RETRACEMENT LEVELS. Thursday’s price action shows FXI approaching its 38.2 Fibonacci retracement level. Watch this level closely.Chart source: StockChartsACP. For educational purposes.
Thursday’s price action is more convincing evidence that this could be the start of a bull rally in the Chinese equities. Shares of Alibaba (BABA), JD.com (JD), Baidu (BIDU), and Yum! Brands (YUM) all saw significant price spikes. Is it worth accumulating positions in FXI? Let’s analyze the daily price action of FXI (see below).

FIGURE 3. DAILY CHART OF FXI. Thursday’s gap up in price adds further confirmation that this could be the beginning of a bull rally in FXI. The On Balance Volume is trending higher, indicating that volume is increasing.Chart source: StockChartsACP. For educational purposes.
FXI gapped up again after Thursday’s news. The daily chart shows that Tuesday’s gap up opened close to the May 17 high. Wednesday’s price action didn’t show any follow-through, but the candlestick bar remained within the body of Tuesday’s candle. Thursday’s candle closed near the open, resembling a doji, which represents indecision. The ideal doji is one where the open and close are the same.
Another encouraging indication is the On Balance Volume (OBV) is trending higher. The 5-day simple moving average overlay on OBV further confirms the increasing volume.
When’s a Good Time to Buy FXI?
David Tepper, founder and president of Appaloosa Management, shared his optimism about China on CNBC. Should you take the same route?
This is just the start of China’s stimulus, and it may take a few months to realize the effects of all this stimulus. So I would look for FXI to reach $33.83. A move higher would be an opportunity to add FXI to your portfolio, as long as the bullish sentiment holds.
Equities, commodities, and cryptocurrencies are riding on this China stimulus news. If FXI sold off at $33.83 or on its way there, that could impact all markets. So watch the activity in FXI, since it could act as an early indicator to an across-the-board selloff.
The bottom line. Add the daily and weekly charts of FXI to your StockCharts ChartLists and continue to monitor them. The weekly chart clearly shows potential entry and exit levels. Set StockCharts Alerts to notify you when FXI hits $33.83.
Last but not least, regularly monitor the SCTR Reports on Your Dashboard.
Disclaimer: This blog is for educational purposes only and should not be construed as financial advice. The ideas and strategies should never be used without first assessing your own personal and financial situation, or without consulting a financial professional.