Author

admin

Browsing

What’s “Froot Loops” in Italian?

The European confectionary company Ferrero has agreed to buy WK Kellogg Co., the manufacturer of iconic American cereals, for $3.1 billion.

The acquisition is set to bring the publicly traded maker of Froot Loops, Frosted Flakes and Rice Krispies under the privately owned Italian manufacturer of Nutella, Tic Tac and Kinder chocolates.

WK Kellogg, based in Battle Creek, Michigan, was spun off from Kellogg’s in 2023, splitting the company’s North American cereal business from its other snack products like Pringles and Pop-Tarts, a unit that is now owned by the publicly traded conglomerate Kellanova. WK Kellogg, one of North America’s largest cereal makers, saw its shares surge more than 30% Thursday on the news of the deal.

The agreement comes after years of slowing demand for sugary breakfast cereals as many consumers look for healthier options. WK Kellogg came under fire last year when CEO Gary Pilnick said on CNBC that households squeezed by food companies’ price hikes should consider eating “cereal for dinner” to save money, part of a marketing pitch the company was making as an answer to inflation.

Yet snack demand, too, has flagged recently, with The Campbell’s Co. and General Mills each warning this year of slower sales as customers prioritize square meals.

Ferrero Rocher chocolates.Alexander Sayganov / SOPA Images / LightRocket via Getty Images file

Ferrero, perhaps best known for its namesake Ferrero Rocher chocolates in gold foil, originated in Alba, Italy, after World War II and is now a multinational food maker headquartered in Luxembourg. The company reported revenue of 18.4 billion euros last fiscal year, up nearly 9% from the one before.

Ferrero executive chairman Giovanni Ferrero described the acquisition Thursday as “a key milestone” in an effort to grow its footprint in North America, where the closely held company sells an array of popular candies.

The deal is among a series of high-profile Ferrero acquisitions in recent years. The firm bought Butterfinger, Baby Ruth and other U.S. candy brands from Nestlé in 2018, then acquired Kellogg’s bakery business, including Famous Amos and Keebler, in 2019 along with the manufacturer of Halo Top ice cream in 2022.

After the transaction closes, WK Kellogg will be delisted from the New York Stock Exchange and become a wholly owned subsidiary of Ferrero. The deal is expected to close later this year.

This post appeared first on NBC NEWS

President Donald Trump’s proposed 50% tariff on Brazilian imports is bad news for coffee drinkers.

Brazil, the largest U.S. supplier of green coffee beans, accounts for about a third of the country’s total supply, according to data from the U.S. Department of Agriculture.

Coffee beans need to grow in a warm, tropical climate, making Hawaii and Puerto Rico the only suitable places in the United States to farm the crop. But, as the world’s top consumer of coffee, the U.S. requires a massive supply to stay caffeinated. Mintel estimates that the U.S. coffee market reached $19.75 billion last year.

The increase in trade duties could leave consumers with even higher costs after several years of soaring coffee prices. Inflation-weary consumers have seen prices for lattes and cold brew climb as droughts and frost hit the global coffee supply, particularly in Brazil. Earlier this year, coffee bean futures hit all-time highs. They rose 1% on Thursday, although still well below the record set in February.

To be sure, there’s still time for Brazil to strike a deal with the White House before the tariffs go into effect on Aug. 1. Plus, food and beverage makers are hoping that the Trump administration will grant exemptions for key commodities. U.S. Department of Agriculture Secretary Brooke Rollins said in an interview in late June that the White House is considering exemptions for produce that can’t be grown in the U.S. — including coffee.

But if that doesn’t happen, coffee companies like Folgers owner J.M. Smucker, Keurig Dr Pepper, Starbucks and Dutch Bros will face much higher costs for the commodity. Giuseppe Lavazza, chair of Italian roaster Lavazza, said on Bloomberg TV on Thursday morning that the latest tariff could mean “a lot of inflation” for the coffee industry.

Roasters will try to mitigate the impact of the higher tariff, but it won’t be easy.

“Every company is always trying to eke out the next efficiency, to dial into their operations or find the way to minimize inflationary pressures, but a 50% tariff on a commodity that fundamentally is not available in the U.S. — you can’t really do much with that,” Tom Madrecki, vice president of supply chain and logistics for the Consumer Brands Association, a trade group that represents the consumer packaged goods industry.

One mitigation tactic could be to import beans from countries other than Brazil, but companies will likely still be paying more for the commodity.

“A characteristic of tariffs, especially when you have tariffs on multiple countries at once, is that not just the inbound cost rises. It allows the pricing floor to also rise,” Madrecki said. “If you have cheaper coffee in a country different than Brazil, you’re not inclined to sell it at a 30% lower cost. You’re going to try to bump your coffee up a bit more, too.”

At-home coffee brands, like JM Smucker’s Dunkin’ and Kraft Heinz’s Maxwell House, have already been hiking their prices this year in response to spiking commodity costs. More price increases could be on the way for consumers, although retailers may push back.

Keurig Dr Pepper would consider additional price hikes in the latter half of the year to mitigate the impact of tariffs, CEO Tim Cofer said in late April, after Trump introduced his initial round of so-called reciprocal duties.

And Smuckers warned investors on its quarterly conference call in early June that tariffs on coffee were weighing on its profits. Coffee accounts for roughly a third of the company’s revenue.

“Green coffee is an unavailable natural resource that cannot be grown in the continental United States due to its reliance on a tropical climate,” Smuckers CEO Mark Smucker said. “We currently purchase approximately 500 million pounds of green coffee annually, with the majority coming from Brazil and Vietnam, the two largest coffee-producing countries.”

Vietnam, which announced a tentative trade deal with the White House earlier this month, supplies about 8% of the U.S.’s green coffee beans. Under the agreement, the U.S. will impose a 20% duty on Vietnamese imports.

Consumers who prefer a caramel macchiato from Starbucks for their caffeine hit will likely see a more muted impact on their wallets.

After several quarters of sluggish U.S. sales, Starbucks CEO Brian Niccol said in late 2024 that the company wouldn’t raise prices in 2025, in the hopes of winning back customers who had complained about how expensive its drinks had gotten. While it waits for its turnaround to take hold, Starbucks might choose to swallow the higher coffee costs.

The coffee giant also benefits from its diversity — both in suppliers and the breadth of its menu, which now includes the popular Refreshers line. Starbucks imports its coffee from 30 different countries, and roughly 10% of its cost of goods sold in North America comes from coffee.

The new trade duty could mean a 0.5% increase in Starbucks’ North American cost of goods sold, assuming about 22% of its beans come from Brazil, TD Cowen analyst Andrew Charles wrote in a note to clients on Thursday. Starbucks’ packaged drinks, which are distributed by Nestle, could see their cost of goods sold increase 3.5%. Altogether, that represents a 5-cent drag on annual earnings per share, according to Charles.

For rival Dutch Bros, higher coffee costs also wouldn’t hurt its bottom line much. Coffee accounts for less than a tenth of the drive-thru coffee chain’s cost of goods sold. Assuming that Dutch Bros sources more than half of its coffee from Brazil, its cost of goods sold would rise just 1.3%, according to Charles’ estimates.

This post appeared first on NBC NEWS

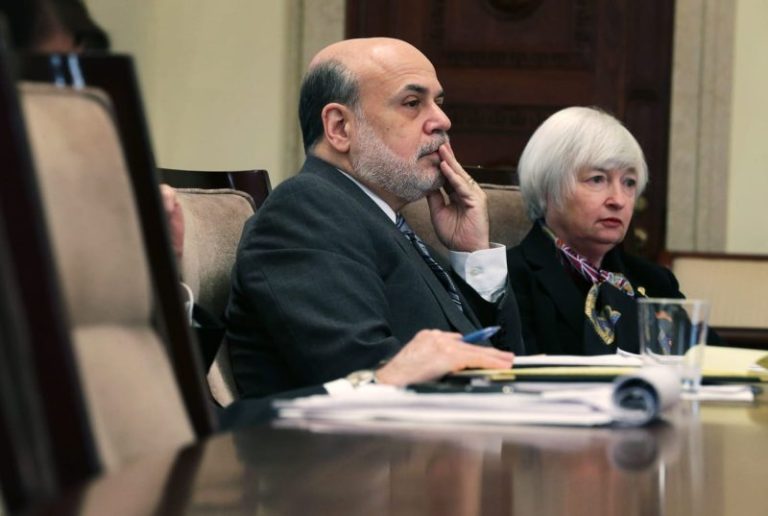
President Donald Trump’s budget chief on Thursday said that Federal Reserve Chairman Jerome Powell “has grossly mismanaged the Fed” and suggested he had misled Congress about a pricey and “ostentatious” renovation of the central bank’s headquarters.

The broadside by Office of Management and Budget Director Russell Vought opened up a new front in Trump’s war of words against Powell.

Trump has repeatedly called on the Fed chairman to cut interest rates, without success. He reportedly has considered firing Powell and, more recently, publicly naming the chairman’s replacement months earlier than the end of Powell’s term next spring.

Vought’s letter raises the question of whether Trump will seek to remove Powell for cause, at least ostensibly.

But the Supreme Court in a recent decision strongly suggested that Federal Reserve board members have special protection from being fired by a president.

“While continuing to run a deficit since FY23 (the first time in the Fed’s history), the Fed is way over budget on the renovation of its headquarters,” Vought wrote in a post on the social media site X.

“Now up to $2.5 billion, roughly $700 million over its initial cost,” Vought wrote. “The cost per square foot is $1,923–double the cost for renovating an ordinary historic federal building. The Palace of Versailles would have cost $3 billion in today’s dollars!”

Vought’s tweet linked to a letter he sent Powell that referenced the Fed boss’s June 25 testimony before the Senate Banking Committee.

“Your testimony raises serious questions about the project’s compliance with the National Capital Planning Act, which requires that projects like the Fed headquarters renovation be approved by the National Capital Planning Commission,” Vought wrote.

“The plans for this project called for rooftop terrace gardens, VIP private dining rooms and elevators, water features, premium marble, and much more,” he wrote.

But Powell, in his testimony, said, “There’s no VIP dining room. There’s no new marble. There are no special elevators. There are no new water features. There’s no beehives and there’s no roof terrace gardens,” Vought wrote.

“Although minor deviations from approved plans may be inevitable, your testimony appears to reveal that the project is out of compliance with the approved plan with regard to major design elements,” Vought wrote.

This post appeared first on NBC NEWS

For those who focus on sector rotation, whether to adjust portfolio weightings or invest directly in sector indexes, you’re probably wondering: Amid the current “risk-on” sentiment, even with ongoing economic and geopolitical uncertainties, can seasonality help you better anticipate shifts in sector performance?

Current Sector Performance Relative to SPY

To find out, let’s first look at how sectors are performing relative to the SPDR S&P 500 ETF (SPY), our S&P 500 proxy. The StockCharts Market Summary Mini Charts tab in the US Sectors panel shows you sector ETF performance and its relative performance against SPY.

FIGURE 1. MARKET SUMMARY US SECTORS PANEL. The new micro charts feature provides a chart of each sector’s ETF plus its relative performance against SPY, allowing you to gauge a sector’s strength against the broader market.

Looking at each sector chart over a three-month time frame, only two sectors are outperforming relative to SPY:

  1. Technology Select Sector SPDR Fund (XLK): Currently outperforming SPY by 13.85%.
  2. Industrial Select Sector SPDR Fund (XLI): Outpacing SPY by a modest 2.53%.

Spotlight on Technology and Industrials: Leading Sectors in a Risk-On Market

As a side note, Technology and Industrials are two sectors that align with the risk-on narrative. This suggests that the market is currently favoring higher-beta stocks (as XLK’s performance reflects) over safer sectors and that demand for industrial goods is generally rising, a sign investors expect the economy to strengthen.

Understanding Sector Seasonality: What History Tells Us

Now, let’s turn to seasonality. In this context, seasonality refers to the tendency for certain sectors to perform better during specific periods and worse during others. While past performance never guarantees future results, it can help you anticipate how a sector might behave based on historical tendencies, not certainties. 

So, what might the seasonality charts suggest about XLK and XLI in the coming months?.

XLK Seasonality Trends: Tech Sector’s Strongest Months

Take a look at XLK’s 10-year seasonality chart.

FIGURE 2. 10-YEAR SEASONALITY CHART OF XLK. While September appears to be tech’s only bearish month from a seasonality perspective, its strongest months are November and July. 

Over 10 years, July has been XLK’s second strongest month, with positive closes 90% of the time and an average monthly return of 4%. The most profitable month is November, with an 89% positive close rate and a 5% average monthly return. August isn’t bad, but July is exceptionally strong and reflects its current overall performance.

XLI Seasonality Patterns: When Industrials Tend to Outperform

Switching over to a seasonality chart of XLI, we get a similar picture.

FIGURE 3. 10-YEAR SEASONALITY CHART OF XLI. July is XLI’s strongest month for positive closes, and November is its strongest month for average seasonal returns.

This pattern is pretty exceptional: over the last 10 years, XLI has posted a historical 100% positive close rate in July, with an average return of 3.5%. The strongest returns, however, tend to occur in November, which shows an 89% positive close rate and an average return of 6.5%. The months in between are relatively unremarkable, making July and November stand out significantly. 

Technical Analysis of XLK and XLI

Will July be another up-month for XLK and XLI? Starting with XLK, let’s switch over to a six-month daily chart.

FIGURE 4. DAILY CHART OF XLK. Tech’s upward trajectory is now in overbought territory, yet there’s little sign of slowing.

XLK is at an all-time high, and there’s no clear indication that it’s pulling back just yet. 

Meanwhile, the Relative Strength Index (RSI) is suggesting that XLK has been occupying overbought territory since late June. However, bear in mind that an RSI reading at this level can sustain itself for an extended period. And if you look at the On Balance Volume (OBV) indicator, it suggests that the buying pressure trend is still rising with no signs of slowing down.

Actionable Tip: Remember, July is one of XLK’s historically strong seasonal months. 

  • But if it does pull back soon, you might expect a bounce near $242.50, which is an area marked by a series of historical swing highs. 
  • Notice how the ZigZag line highlights these key swing points. 
  • Other areas of support sit around $235, its most recent swing low, and $225, the level of its most recent swing low.

Now let’s turn to the daily chart of XLI.

FIGURE 5. DAILY CHART OF XLI. Industrials are also surging, although buying pressure may be starting to decline.

Similar to the previous chart, XLI shows a move higher that places it well into all-time high territory. July is also an exceptionally strong month for XLI, but does it have enough fuel to return the seasonal 3.5% that it typically averages this month?

The RSI signals that XLI may be overbought, which, again, can remain there for some time, while the OBV suggests that buying pressure may be easing into a pullback. However, price continues its upward trajectory.

Actionable Tip: If XLI dips, the pullback may be shallow, potentially bouncing near $145, its most recent swing high. A more substantial support level lies around $141, where multiple swing lows have formed. If XLI drops below $141, you can expect further downside movement.

At the Close

While no strategy can guarantee success, combining seasonality insights with price action can help improve your market timing. Keep an eye on support levels as well as momentum and volume. Remember that the strongest months for XLK and XLI tend to be July (the current month) and November. You can add XLK and XLI to your ChartLists and keep an eye on them, especially in the months ahead. 

However, the big takeaway here is to consider using seasonality charts alongside the various tools in the Market Summary, whether you’re considering an individual stock, index (sector or industry), or other asset classes, like commodities and monetary metals. While price action can help you nail down specific market opportunities, seasonality charts can help contextualize current price action and anticipate potential future market scenarios.


Disclaimer: This blog is for educational purposes only and should not be construed as financial advice. The ideas and strategies should never be used without first assessing your own personal and financial situation, or without consulting a financial professional.

After months of whiplash sector swings, the market may finally be showing signs of settling down. 

In this video, Julius de Kempenaer uses Relative Rotation Graphs (RRG) to analyze asset class rotation at a high level and then dives into sectors and factors. Julius highlights the rotation into cryptocurrencies and the S&P 500, followed by an analysis of the S&P sectors that are driving the market’s move higher. He then analyzes factors — growth, value, and size. 

Discover where capital is shifting now, which sectors are powering the broad index advance, and which factors are displaying or hinting at fresh leadership. You might find a few surprises.

If you’re hunting for the next move or want a clear road map of the stock market’s rotation story, this video is your cheat sheet. 

The video was originally published on July 9, 2025. Watch it on our dedicated page for Julius.

Past videos from Julius can be found here.

#StayAlert, -Julius

When sector performance shifts gears from one day to the next, it’s best to be prepared with a handful of stocks from the each of the sectors. 

In this hands-on video, David Keller, CMT, highlights his criteria for picking the top stocks in 10 of the 11 S&P sectors

Discover the importance of trends, moving averages in the right order, breakouts above resistance levels, relative strength, and many other conditions that make a stock a powerful candidate in each sector. You’ll also learn how to add annotations to your charts, set alerts, and identify potential breakout points. 

Whether you’re looking to diversify or line up your next investment, this video gives you a sector-by-sector playbook that you can put to work today. So, jump in now and get ahead of the next sector rotation. 

The video premiered on July 9, 2025. Watch on StockCharts’ dedicated David Keller page!

Previously recorded videos from Dave are available at this link.

A good trade starts with a well-timed entry and a confident exit. But that’s easier said than done. 

In this video, Joe Rabil of Rabil Stock Research reveals his go-to two-timeframe setup he uses to gain an edge in his entry and exit timings and reduce his investment risks. 

Joe shows you how he spots the big trends on a higher timeframe chart and then drops to a shorter timeframe chart to pinpoint his entries and exits. Watch him dissect the S&P sectors, overall market, and specific symbols using the multiple timeframe approach. Follow along and come up with a systematic method that can help you gain more confidence in your investment decisions.  

The video premiered on July 2, 2025. Click this link to watch on Joe’s dedicated page. 

Archived videos from Joe are available at this link. Send symbol requests to stocktalk@stockcharts.com; you can also submit a request in the comments section below the video on YouTube. Symbol Requests can be sent in throughout the week prior to the next show.

Mining giant BHP (ASX:BHP,NYSE:BHP,LSE:BHP) has been ordered to pay 2,200 of its Central Queensland coal miners an average of AU$30,000 more following a ruling from the Fair Work Commission (FWC).

The ruling stems from a case brought by the Mining and Energy Union and the Australian Manufacturing Workers’ Union against BHP. It was centered on 2024’s Same Job, Same Pay reforms.

The unions argue that BHP is underpaying workers at its Queensland coal operations by using an internal labor hire firm, OS Production and Maintenance.The case cites the Same Job, Same Pay legislation, which requires labor hire workers to receive equivalent pay and conditions as direct employees performing the same roles.

The FWC made the ruling on Monday (July 7), saying BHP must adjust each of its 2,200 workers at the Sarahi, Peak Downs and Goonyella Riverside coal mines’ wages with an additional AU$30,000.

The amount will align the workers’ wages with those of BHP’s direct employees performing the same roles, and could total to roughly AU$1.3 billion per year for the major mining company.

Several local and national labor groups commented on the decision, with the Australian Council of Trade Unions (ACTU) calling it a “winning wage justice for workers.”

“(This) stops labor hire workers (from) being treated as second class citizens,” said ACTU Secretary Sally McManus in a Monday release. “Wealthy mining companies like BHP have clawed money out of workers’ pay packets for many years when the income should be returned to workers, their families and the communities they support.”

She added that the ruling will have “a flow-on effect” throughout the mining industry and beyond, highlighting that the use of labor hire rorts to undercut wages is no longer lawful.

Meanwhile, the Mineral Council of Australia commented that the ruling is “incredibly disappointing.”

In a Monday statement, Minerals Council of Australia CEO Tania Constable said the decision will “directly threaten thousands of specialized contractors who play a vital role in mining operations across the country.”

She added, “(It) also confirms that instead of a ‘straight exclusion’ for service contractors, almost any service contractor could be captured by the legislation unless they can litigate their way out.’

Constable also noted that the Australian mining industry supports 1.25 million jobs, adding that service contractors contribute essential expertise across a wide range of tasks.

BHP has not yet released a statement following the reports, but a spokesperson told NewsWire that it notes the ruling and is studying the decision; it will comply with any orders made.

“Clearly this will have implications for our business,’ the spokesperson said.

Securities Disclosure: I, Gabrielle de la Cruz, hold no direct investment interest in any company mentioned in this article.

This post appeared first on investingnews.com

Royal Gold (NASDAQ:RGLD) has announced plans to acquire Sandstorm Gold (TSX:SSL,NYSE:SAND) and Horizon Copper (TSXV:HCU,OTCQB:HNCUF) in a pair of deals valued at a combined US$3.7 billion.

The companies involved confirmed the transactions in back-to-back press releases on Monday (July 7).

Royal Gold will acquire Sandstorm Gold in an all-share transaction worth approximately US$3.5 billion, and will separately acquire Horizon Copper for US$196 million in cash.

The deal will consolidate three complementary portfolios into a single entity operating under the Royal Gold name, with 393 royalty and streaming interests, including 80 cash-flowing assets. Upon closing, Sandstorm shareholders will own 23 percent of the newly combined Royal Gold, with existing Royal Gold shareholders retaining 77 percent.

Sandstorm President and CEO Nolan Watson called the announcement “a significant milestone.’

“This transaction rewards Sandstorm shareholders in the near term while also offering a compelling opportunity to own a large-scale, world-class streaming and royalty company with continued upside potential,” he said. “Joining forces with Royal Gold will amplify the strengths of Sandstorm’s portfolio and unlock new opportunities for our shareholders.”

The resulting pro-forma Royal Gold will be heavily weighted toward precious metals, with gold contributing 75 percent of 2025 revenues. Its portfolio will span North and South America, Africa and select operations in Asia and Europe.

The expanded company will also inherit exposure to a pipeline of high-profile development assets, including the MARA copper-gold project in Argentina by Glencore (LSE:GLEN,OTC Pink:GLCNF), Hod Maden in Turkey by SSR Mining (TSX:SSRM,NASDAQ:SSRM,ASX:SSR), Platreef in South Africa by Ivanhoe Mines (TSX:IVN,OTCQX:IVPAF) and the Warintza copper project in Ecuador under Solaris Resources (TSX:SLS,NYSEAMERICAN:SLSR).

Another notable addition is the Mount Milligan mine in BC, where Royal Gold holds rights to significant gold and copper streams. The site, operated by Centerra Gold (TSX:CG,NYSE:CGAU), is expected to produce up to 185,000 ounces of gold and 60 million pounds of copper in 2025.

Royal Gold will also strengthen its interests in assets like the Cortez Complex and Pueblo Viejo mine. Jointly owned by Barrick Mining (TSX:ABX,NYSE:GOLD) and Newmont (TSX:NGT,NYSE:NEM), Pueblo Viejo’s plant was recently expanded; output is targeted at an average of 800,000 ounces of gold annually on a 100 percent basis through the mid-2040s.

Also included is a 1.66 percent net profit interest in Antamina, a major copper producer in Peru operated by a Glencore-led joint venture. A US$2 billion expansion was recently approved to extend mine life through 2036.

Securities Disclosure: I, Giann Liguid, hold no direct investment interest in any company mentioned in this article.

This post appeared first on investingnews.com

China’s grip on the battery metals sector has drawn increasing scrutiny in recent years as nations confront growing concerns around supply chain risk and resource security.

Through a blend of domestic output and aggressive overseas investment, particularly in Africa and South America, Chinese companies now command a significant share of upstream supply.

The country is responsible for roughly 60 percent of global rare earths production and controls over 70 percent of cobalt supply through its stakes in mines across the Democratic Republic of Congo.

Meanwhile, its lithium footprint continues to grow through key assets in Chile, Argentina and Australia, reinforcing China’s strategic control across the entire battery metals value chain.

In addition to resource extraction China also firmly controls the global midstream of the battery metals supply chain, particularly in refining and processing. The country currently accounts for approximately 70 to 72 percent of lithium refining and 68 percent of cobalt refining, with similar dominance in graphite and rare earth processing.

China’s control of the battery metals supply chain was a dominant theme at the Fastmarkets Lithium Supply & Battery Raw Materials conference held at the end of June in Las Vegas.

During the “Building North America’s Sustainable EV and ESS Supply Chain” expert panelists explored complex forces shaping the battery supply chain, pointing to the intersection of commodities, geopolitics and evolving technologies as critical pressure points.

Chris Berry, founder and president of House Mountain Partners, stressed the importance of mastering midstream production amid shifting chemistries, and called for bold action, specifically, increased funding for refining and next-generation processing.

He also advocated for selective collaboration with China, highlighting the necessity of leveraging mutual strengths in a deeply interlinked global market.

For Berry, a convergence of high interest rates, volatile metal prices and deepening policy uncertainty is keeping critical investment sidelined at a time when it’s most needed.

Speaking to current market dynamics, Berry noted that while capital was readily available two years ago — when lithium traded around US$80,000 per tonne and other metals saw record highs — today’s environment is far less favorable.

“The cost of capital is much higher, and policy uncertainty is the biggest issue investors are grappling with,” he said, pointing to unpredictable tariff measures and export controls as key deterrents.

For institutional investors and private equity funds, that lack of clarity makes it nearly impossible to deploy capital into battery supply chains with confidence.

The timing couldn’t be worse, Berry added, as nations seek to reindustrialize and compete with China’s dominant position. “Any delay in getting money into the ground today means falling further behind tomorrow.”

Lithium’s boom/bust cycle

After 15 years in the lithium space and three boom-bust cycles, Berry sees the market once again caught between extremes.

“In each cycle, prices have overshot on the upside and overcorrected on the downside,” he said, noting that lithium peaked around US$85,000 per metric ton in late 2022 — well above sustainable levels.

Fast forward to mid-2025, and the price has tumbled to just over US$8,000, a level Berry also considers unsustainable given the strength of long-term demand.

Despite price volatility, he still expects lithium demand to grow by 20 percent annually through the end of the decade — requiring the industry to double in size by 2030. But with investor hesitation and incentive pricing far off, capital is slow to flow into new supply.

“How is it supposed to double when the economics aren’t there?” he asked, warning that delays today could set the stage for the next inevitable boom. For now, opaque pricing and limited market visibility continue to challenge investors and developers alike.

Western refining capacity

During his panel discussion Berry suggested that the west look to the midstream segment of the battery metals supply chain as an opportunity for growth.

“I would fund the refining portion of the supply chain, whether that’s refining raw materials, lithium, nickel, what have you, or magnets, next generation technology. That to me, is really the bottom line and where the government should focus,” he told the attendees.

Berry expanded on his answer explaining that mines can take over a decade to be fully permitted while refining and processing sites have a much shorter lead time.

For Berry, the buildout of western refining and processing is the logical step in wresting some of the supply chain control out of China’s hands.

“If we’re talking about how we can lessen dependence on China? That’s how you do it. You strike a deal with raw material providers or producers. Maybe they’re Canadian, maybe they’re Australian, maybe it’s Chilean. Maybe it’s a country in Africa. But, the process of capacity is absolutely critical. It’s much faster to production,” he said.

Partnership and collaboration

While Berry is adamant that more refining capacity outside of China is needed, he is not opposed to strategic partnerships and alliances with the nation.

“It’s a US$500 billion a year relationship. You think about trade between the US and China, and I don’t even know if it’s feasible to unwind that,” he said during the panel.

“I don’t think it’s wise to be honest with you, but with respect to the EV supply chain, I just think, why wouldn’t we try and find a way to selectively partner and leverage each other’s strengths?”

Securities Disclosure: I, Georgia Williams, hold no direct investment interest in any company mentioned in this article.

This post appeared first on investingnews.com